Availability and Events reports
Hostgroups-Incidents-1
Description
This report provides an overview of host exception events and unavailability.
How to interpret the report
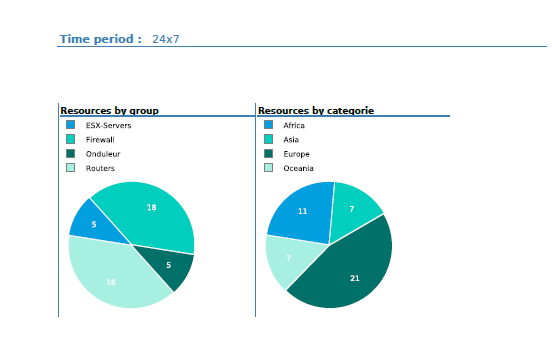
On the cover sheet, two pie charts show the number of hosts by host groups and host categories.
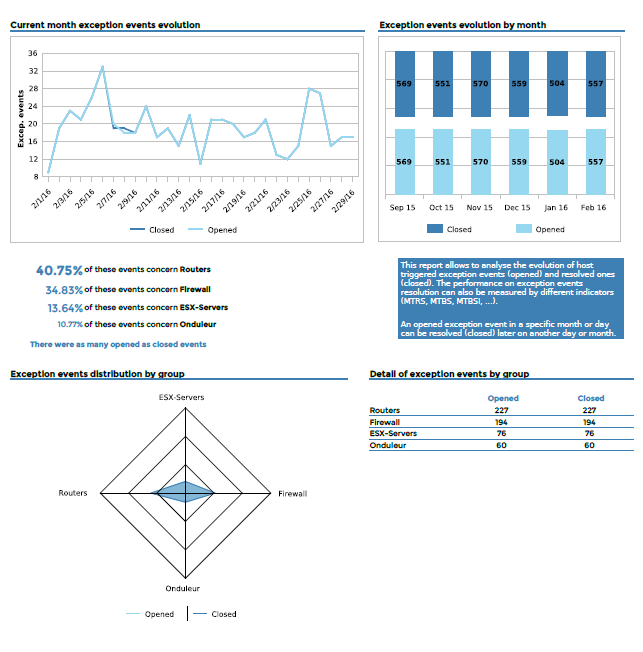
On the first page, the graphs show the evolution of exception events by day and by month. A radar graph provides the exception event distribution by host groups.
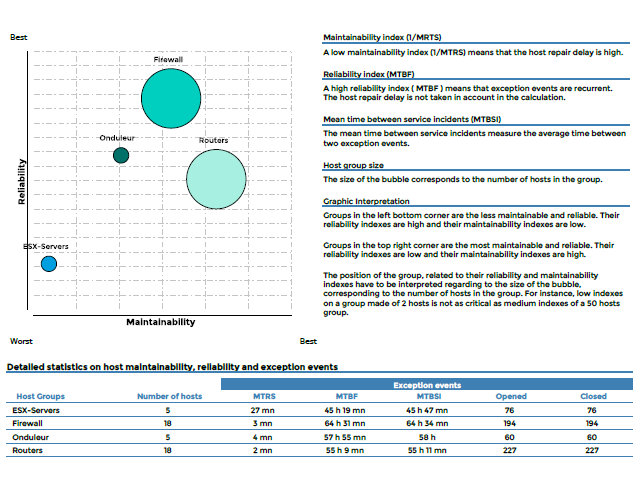
On the second page, the graph shows the maintainability and reliability of the host groups, as determined by an index based on MTRS and MTBF times.
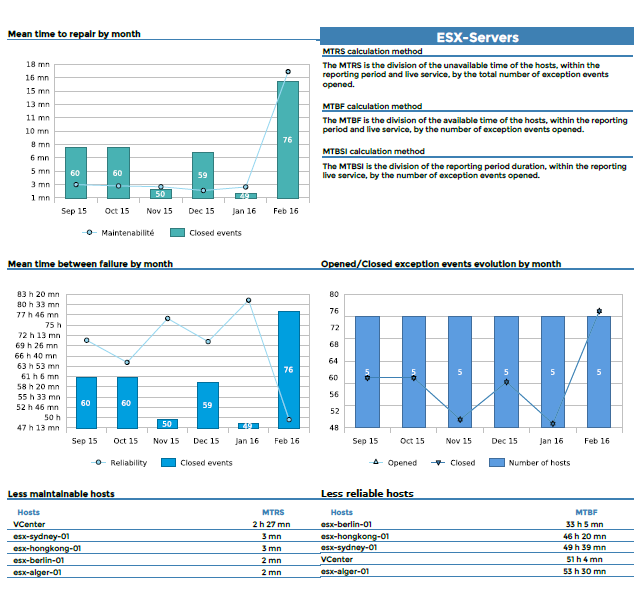
Afterwards, a series of bar charts present information by host group, showing the evolution of exception events by host type. Finally, there is a comparison of the least maintainable and reliable host for each host group.
Cover sheet
First page
Second page
For each host group
Parameters
Parameters required for the report:
- The reporting period.
- The following Centreon objects:
| Parameter | Parameter type | Description |
|---|---|---|
| Hostgroups | Multi selection | Select host groups. |
| Host Categories | Multi selection | Select host categories. |
| Time period | Dropdown list | Specify time period. |
| Interval | Text field | Specify no. of months in trend graphs. |
Hostgroups-Availability-1
Description
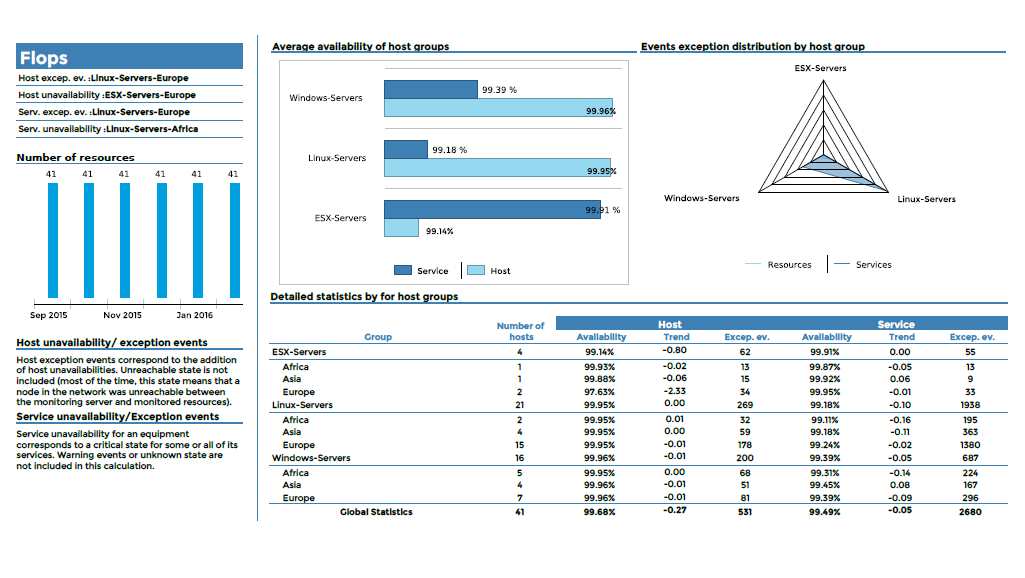
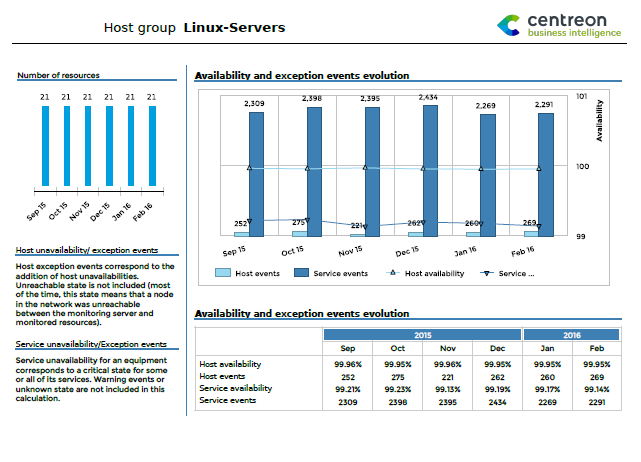
This report shows availability, exception-type events for hosts and services of multiple host groups. It also shows the evolution of the hosts for each host group, the evolution of availability and number of exception events for hosts and services.
How to interpret the report
On the first page, the report displays a graph of the host and service availability for hostgroups, exception-events distribution, evolution of the number of resources, and a cross table detailing the statistics for all the previous information.
On the following pages, evolution of the unavailability and exception events is detailed for each host group, sorted by host categories and service categories.
Finally, host and service statistics are displayed with the top-most unavailability and exception events.
First page
For each host group
First page
Second page
Parameters
Parameters required for the report:
- The reporting period
- The following Centreon objects:
| Parameter | Parameter type | Description |
|---|---|---|
| Hostgroups | Multi selection | Select host groups. |
| Host Categories | Multi selection | Select host categories. |
| Service Categories | Multi selection | Select service categories. |
| Time period | Dropdown list | Specify time period. |
| Interval | Text field | Specify no. of months in trend graphs. |
Hostgroup-Availability-2
Description
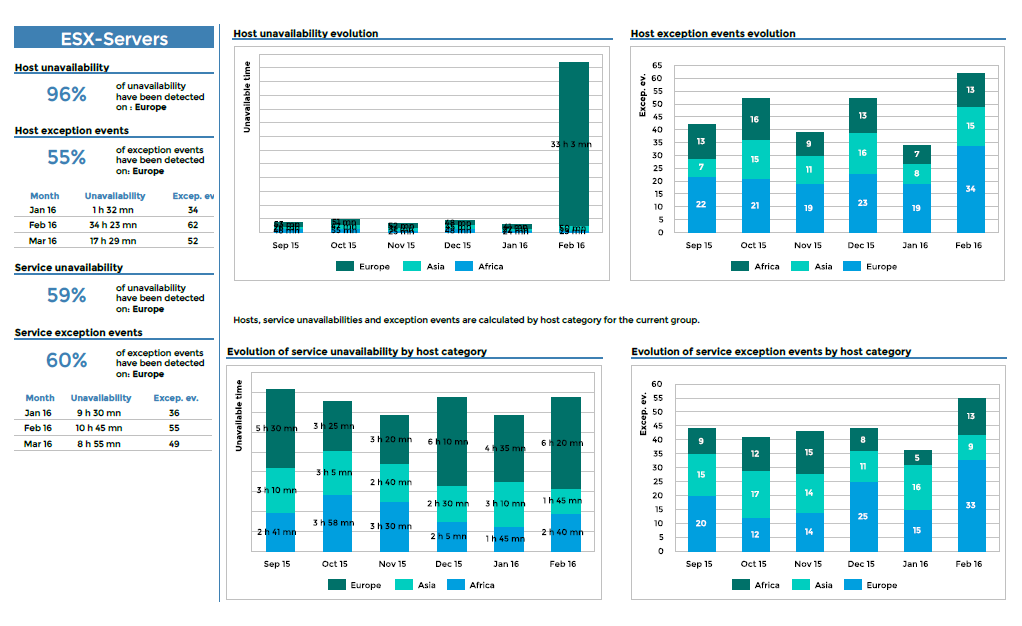
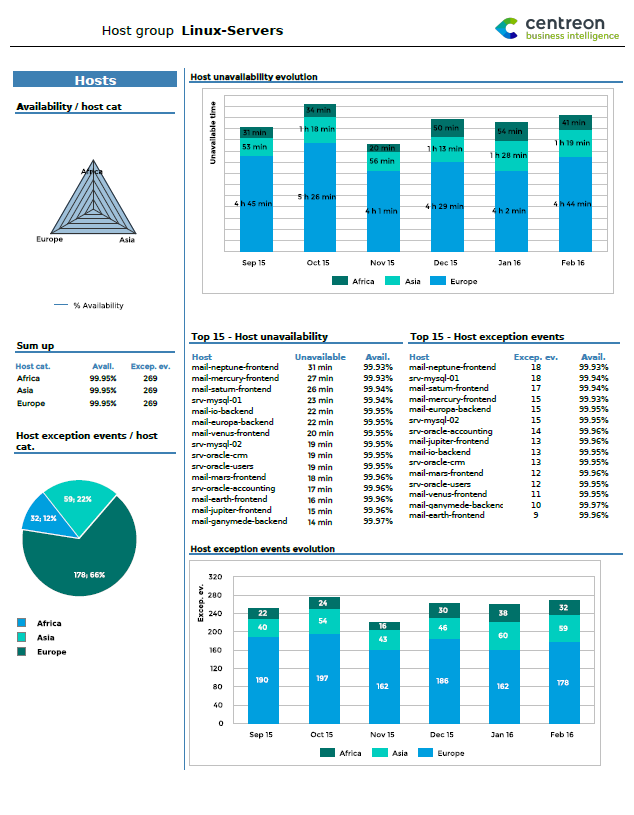
This report displays information about availability and exception events for a host group.
How to interpret the report
On the first page, the evolution of availability and exception events is displayed for hosts and services. The evolution of host group resources is also shown.
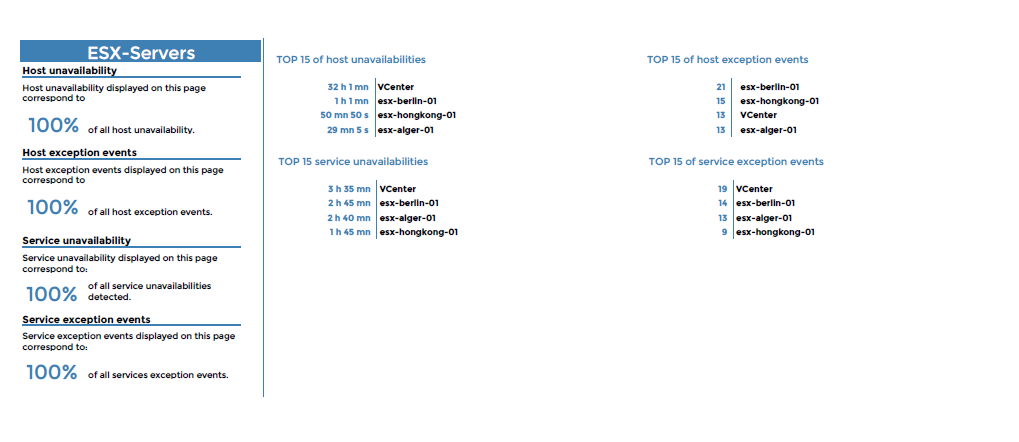
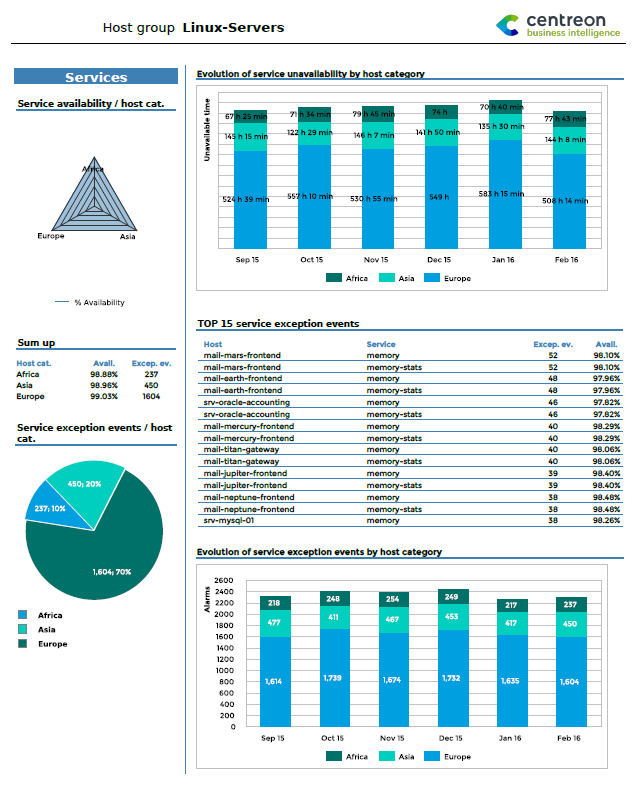
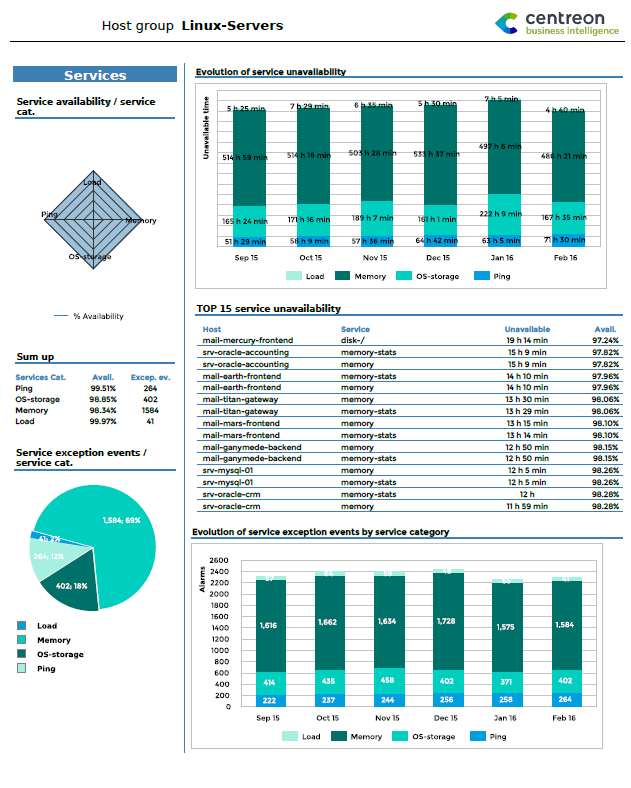
On the second page, statistics are shown for detailed availability and exception events on a host according to category. A table lists the hosts that were least available and that created the largest number of exception events.
On the two last pages, detailed statistics for indicators on availability and exception events are shown. The information is organized by host and service category. The top 15 hosts are listed in terms of service unavailability and exception events.
First page
Second page
Third & Fourth pages
and
Parameters
Parameters required for the report:
- Reporting period
- The following Centreon objects:
| Parameter | Parameter type | Description |
|---|---|---|
| Host group | Drop-downlist | Select host group. |
| Host Categories | Multi select | Select host categories. |
| Services Categories | Multi select | Select host categories. |
| Time period | Dropdown list | Time period to report. Note: Only use the time period from the ETL month properties. |
| Evolution interval | Text field | Specify no. of months of history for the evolution graph |
Hostgroup-Service-Incident-Resolution-2
Description
This report displays the rate of acknowledged and resolved events, the longest-lasting events, the least reliable indicators, and hosts generating the most events for a given host group.
How to interpret the report
The first graph displays the rate of acknowledged and resolved events within a specific time frame.
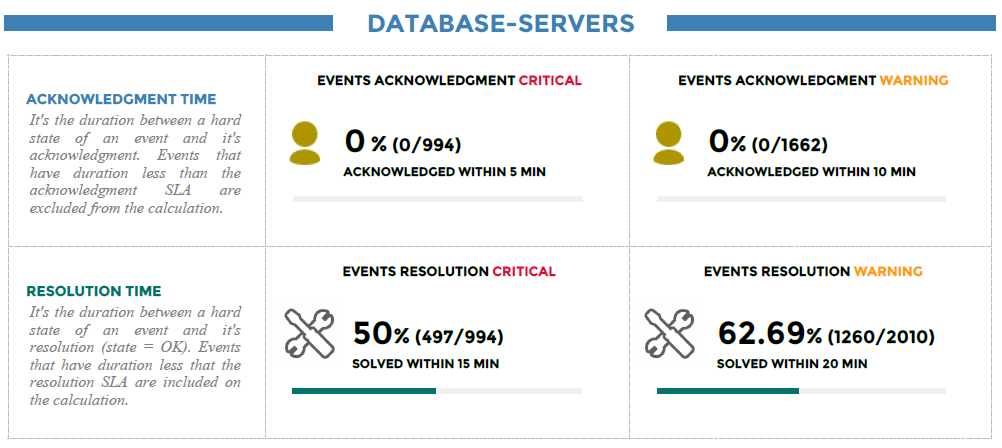
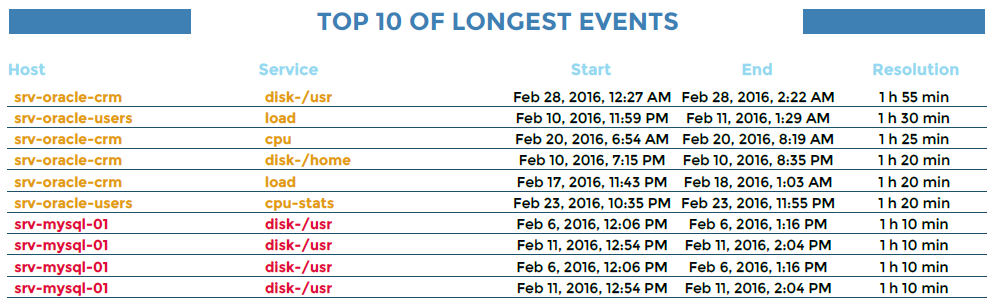
The second graph displays the top 10 longest events with the start, end and resolution time.
Indicators in a critical-state appear in red, in a warning-state in orange, and an unknown state in gray.
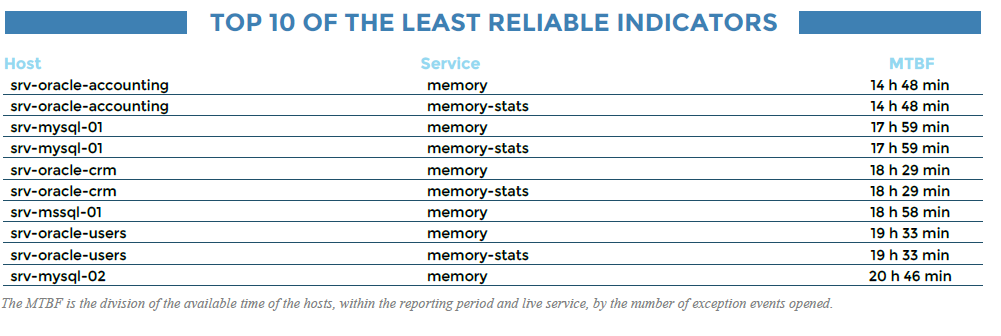
The third graph in the report displays the top 10 the least reliable indicators.
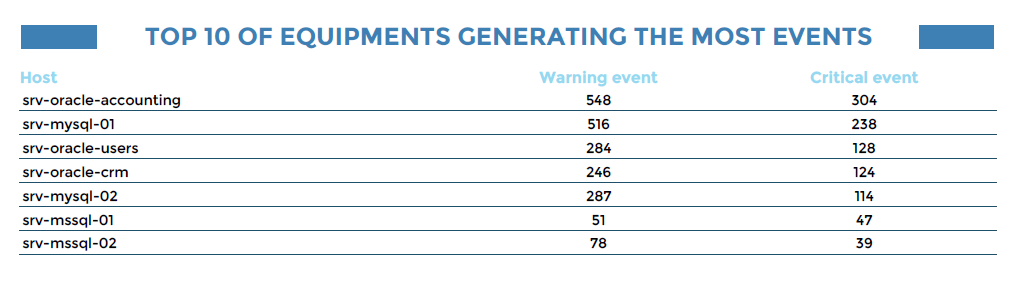
Finally, the top 10 hosts generating the most events.
Parameters
Parameters required for the report:
- Reporting period
- SLA of acknowledgment in minutes
- SLA of resolution in minutes
- The number of rows to display in top objects
- The following Centreon objects:
| Parameter | Parameter type | Description |
|---|---|---|
| Hostgroups | Multi selection | Select host groups. |
| Host Categories | Multi selection | Select host categories. |
| Service Categories | Multi selection | Select service categories. |
| Time period | Dropdown list | Specify time period. |
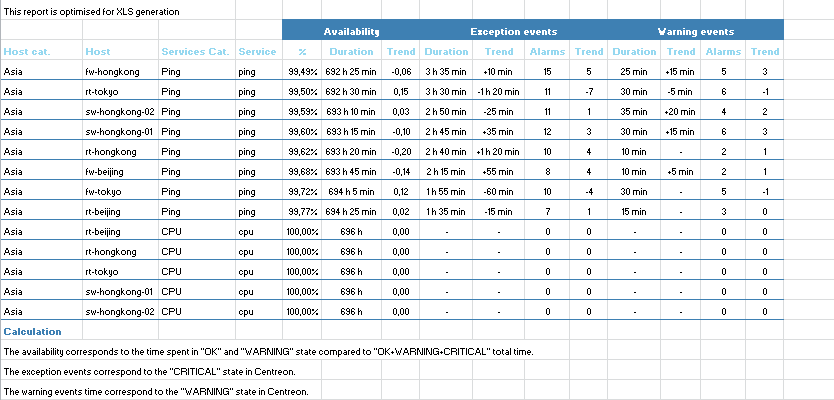
Hostgroup-Host-Availability-List
Description
This report displays information on availability and exception events for hosts within a hostgroup.
How to interpret the report
For each host, the table lists the percentage of availability, unavailability and number of exception events and trends.
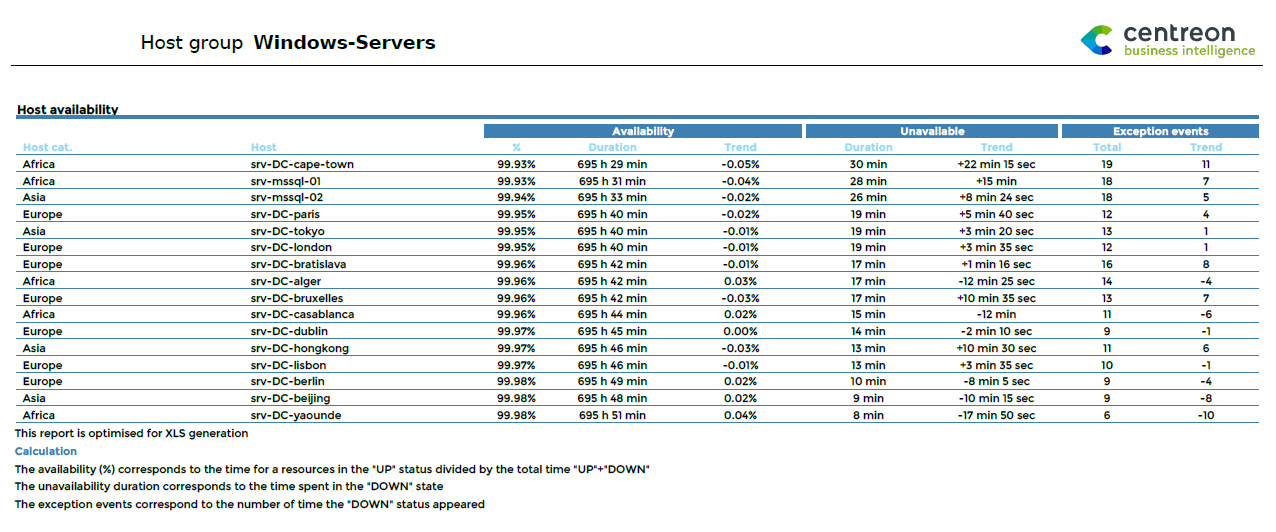
This report is optimized for generating XLS files.
Parameters
Parameters required for the report:
- Reporting period
- The following Centreon objects:
| Parameter | Parameter type | Description |
|---|---|---|
| Host group | Drop-down list | Select host group. |
| Hosts Categories | Multi select | Select host categories |
| Time period | Drop-down list | Specify time period |
Hostgroup-Host-Event-List
Description
This report provides a list of exception events for hosts.
How to interpret the report
The table contains detailed statistics on critical or warning-type exception events on hosts indicating start, acknowledgment and end dates. The report also calculates the real and the effective MTRS for each event.
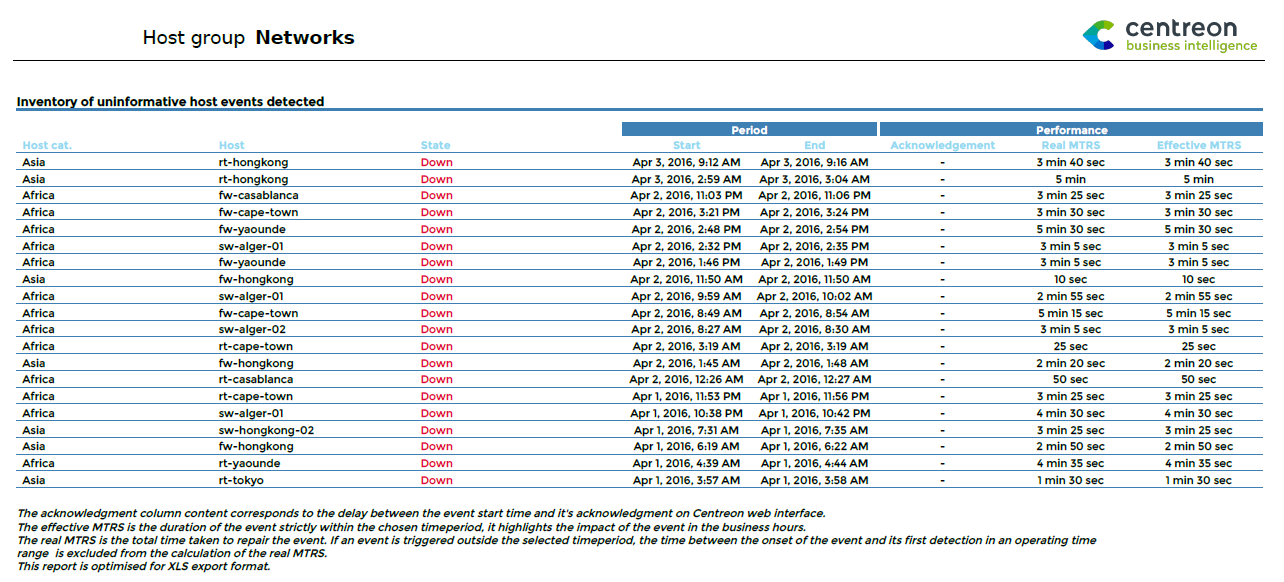
This report is optimized for generating XLS files.
Parameters
Parameters required for the report:
- Reporting period
- The following Centreon objects:
| Parameter | Parameter type | Description |
|---|---|---|
| Host group | Drop-down list | Select host group. |
| Hosts Categories | Multi select | Select host categories. |
| Time period | Drop-down list | Specifiy time period |
Hostgroup-Service-Availability-List
Description
This report displays events and the availability of services for a host group.
How to interpret the report
For each service, detailed statistics are provided: availability (in percentage), unavailability, exception and warning events, as well as the trends for these various indicators.
This report is optimized for generating XLS files.
Parameters
Parameters required for the report:
- The reporting period
- The following Centreon objects:
| Parameter | Parameter type | Description |
|---|---|---|
| Hostgroup | Drop-down list | Select host group. |
| Host Categories | Multi selection | Select host categories. |
| Service Categories | Multi selection | Select service categories. |
| Time period | Dropdown list | Specify time period. |
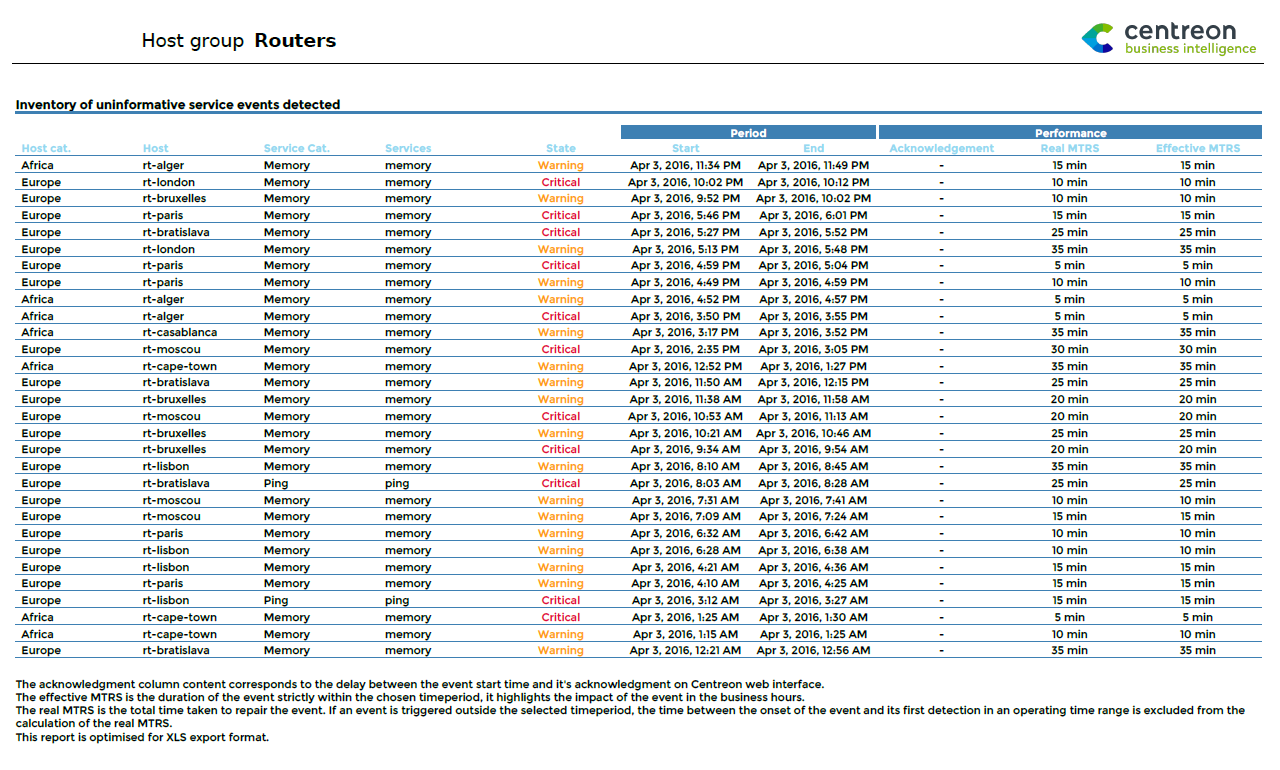
Hostgroup-Service-Event-List
Description
This report displays a table listing critical or warning-type events for services in a hostgroup.
How to interpret the report
The report also calculates the real and the effective MTRS for each alarm. A table contains detailed statistics on events occurring on hosts indicating start, acknowledgment and end dates.
Parameters
Parameters required for the report:
- Reporting period
- The following Centreon objects:
| Parameter | Parameter type | Description |
|---|---|---|
| Hostgroup | Drop-down list | Select host group. |
| Host Categories | Multi selection | Select host categories. |
| Service Categories | Multi selection | Select service categories. |
| Time period | Dropdown list | Specify time period. |
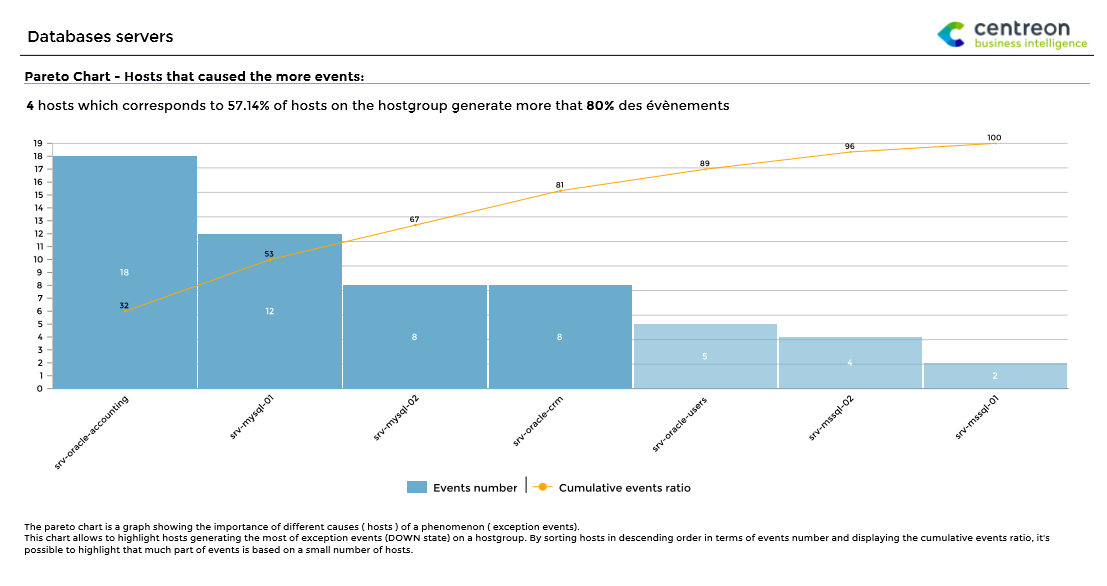
Hostgroup-Host-Pareto
Description
This report allows you to identify hosts responsible for the largest number of exception events in a host group. The data is represented in a Pareto chart.
How to interpret the report
Hosts responsible for 80% of events are highlighted. Hosts are sorted in descending order in terms of number of generated events. The ratio of cumulative events is also shown.
This report helps you to focus on the most problematic hosts by applying the Pareto principle (or 80-20 rule): approximately 80% of the effects come from 20% of the causes.
Parameters
Parameters required for the report:
- Reporting period
- The following Centreon objects:
| Parameter | Parameter type | Description |
|---|---|---|
| Hostgroup | Drop-down list | Select host group. |
| Host Categories | Multi selection | Select host categories. |
| Time period | Dropdown list | Specify time period. |
Hostgroups-Host-Current-Events
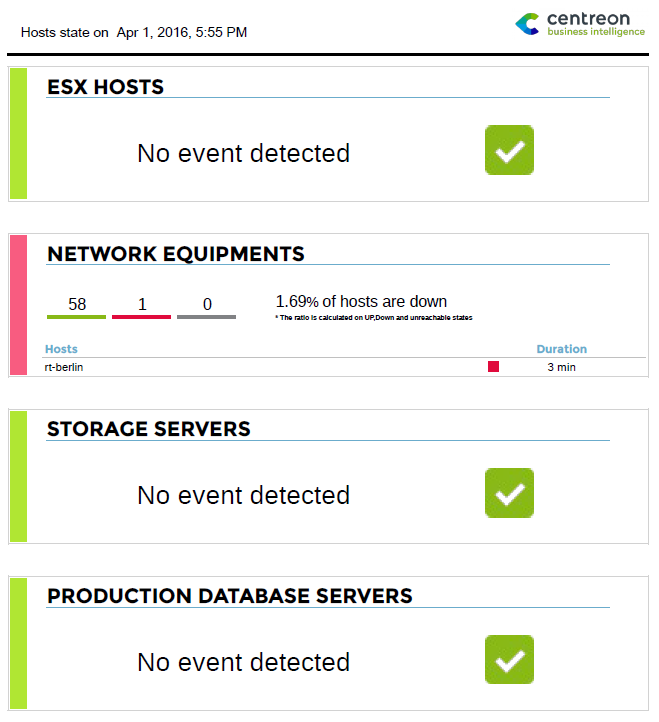
Description
This is one of the only reports that displays the events occurring on hosts at the time it is generated rather than the events up to the previous day.
How to interpret the report
The report consists of four parts. On each part, you can use a filter to select a restricted perimeter for host groups and host categories. Data is displayed with real-time results when the report is generated. In addition:
- Events can be sorted by state, duration or hostname.
- You can display and/or filter acknowledged hosts or hosts in downtime.
- Only confirmed events (hard state) are taken in account.
- A report can have fewer than four parts by specifying the value -1 in its title.
Parameters
Parameters required for the report:
| Parameters | Type | Description |
|---|---|---|
| Title | Text field | Specify the title for part 1 of report. |
| Hostgroups | Multi select | Select host groups for part 1 of report. |
| Host category | Multi select | Select host categories for part 2 of report. |
| Title | Text field | Specify title for part 2 of report. |
| Hostgroups | Multi select | Select host groups for part 2 of report. |
| Host category | Multi select | Specify host categories for part 2 of report. |
| Title | Text field | Specify title for part 3 of report. |
| Hostgroups | Multi Select | Select host groups to use for part 3 of report. |
| Host category | Multi select | Select host categories for part 3 of report. |
| Title | Text field | Specify title for part 4 of report. |
| Hostgroups | Multi select | Specify host groups for part 4 of report. |
| Host category | Multi select | Select host categories for part 4 of report. |
| sort_by | Radio button | Sort results by state, duration or host name. |
| display_ack | Radio button | Display or filter acknowledged hosts. |
| display_downtime | Radio button | Display or filter hosts in downtime. |
Hostgroups-Service-Current-Events
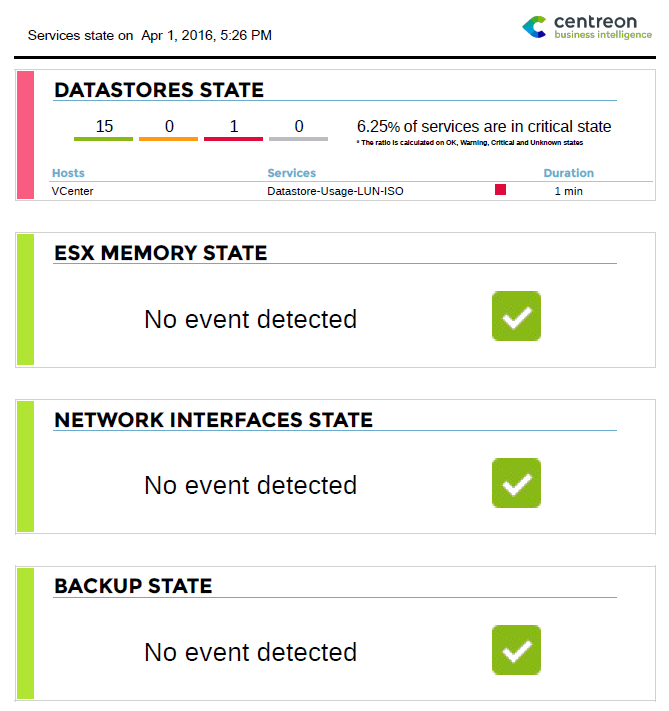
Description
This is one of the only reports that displays the events occurring on services at the time it is generated rather than the events up to the previous day.
How to interpret the report
This report consists of four parts. On each part, you can use a filter to select a restricted perimeter for host groups, host categories and service categories. Data is displayed with real-time results when the report is generated. In addition:
- Events can be sorted by state, duration or hostname.
- You can display and/or filter acknowledged hosts or hosts in downtime.
- Only confirmed events (hard state) are taken in account.
- A report can have fewer than four parts by specifying the value -1 in its title.
Parameters
Parameters required by the report:
| Parameters | Type | Description |
|---|---|---|
| title | Text field | Specify title for part 1 of report. |
| Hostgroups | Multi select | Select host groups for part 1 of report. |
| Host category | Multi select | Select host categories for part 2 of report. |
| Service category | Multi select | Select service categories for part 1 of report. |
| title | Text field | Specify title for part 2 of report. |
| Hostgroups | Multi select | Select host groups for part 2 of report. |
| Host category | Multi select | Select host categories for part 2 of report. |
| Service category | Multi select | Select service categories for part 2 of report. |
| title | Text field | Specify title for part 3 of report. |
| Hostgroups | Multi Select | Select host groups for part 3 of report. |
| Host category | Multi select | Select host categories for part 3 of report. |
| Service category | Multi select | Select service categories for part 3 of report. |
| title | Text field | Specify title for part 4 of report. |
| Hostgroups | Multi select | Select host groups for part 4 of report. |
| Host category | Multi select | Select host categories for part 4 of report. |
| Service category | Multi select | Select service categories for part 4 of report. |
| sort_by | Radio button | Sort results by state, duration or hostname. |
| display_ack | Radio button | Display or filter acknowledged hosts. |
| display_downtimes | Radio button | Display or filter hosts in downtime. |
| display_only_critical | Radio button | Display only services in critical state. |